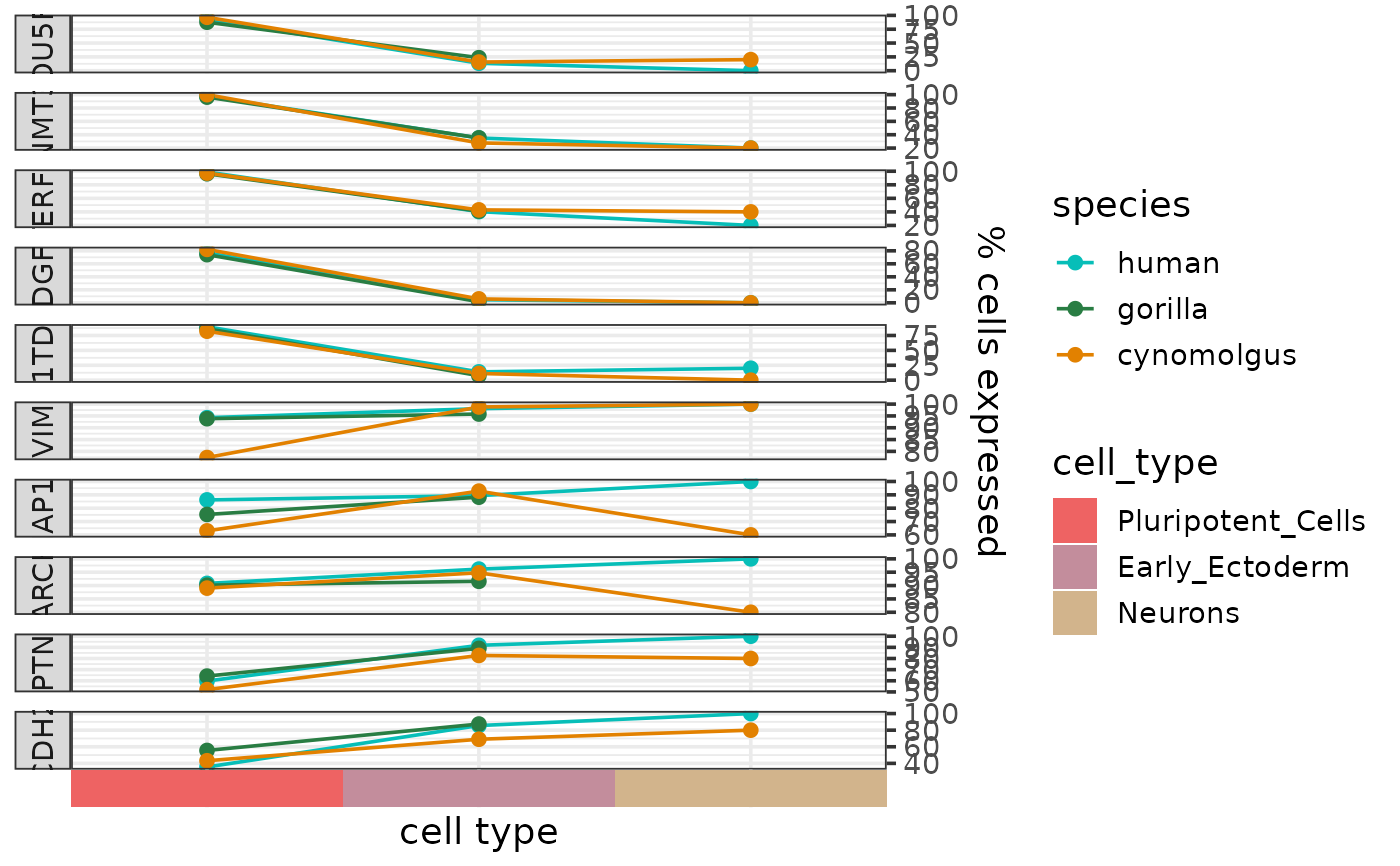
Plots the summarized expression of one or more genes per cell type and species as a line plot, and thus allows the expression patterns to be visually compared across species.
Usage
plotSumExprLine(
  genes,
  sce,
  summary_metric = "pct",
  cell_type_column = "cell_type",
  species_colors = NULL,
  cell_type_colors = NULL,
  font_size = 14
)
Arguments
- genes
Character vector, the names of the genes for which the expression profiles should be plotted.
- sce
SingleCellExperimentobject containing the expression data (raw counts, logcounts and metadata) for all network genes. Required metadata columns:- species
Character, the name of the species.
- {{cell_type_column}}
Character, cell type annotation.
- summary_metric
Character, the metric for summarizing the expression of a gene per cell type and species. One of "pct" (the percent of cells expressing the gene, the default) and "mean" (mean expression in logcounts).
- cell_type_column
Character, the name of the cell type annotation column in the metadata of
sce.- species_colors
Character vector, colors per species.
- cell_type_colors
Character vector, colors per cell type.
- font_size
Numeric, font size (default: 14).
Value
A line plot as a ggplot object showing the summarized expression levels of the genes per cell type and species.
Details
The expression of each input gene is summarized either as the percent of cells expressing the given gene (if summary_metric = "pct", the default) or the mean expression and its 95
The summarized expression levels are then visualized as a scatter plot across the cell types, colored by species and faceted by gene. To aid visual comparison across species, the data points of the same species are connected by lines across the cell types (this is not meant to represent continuity).
The cell types are depicted below the plot using cell_type_colors.
See also
Other functions to plot gene expression profiles:
plotExprAlongPseudotime(),
plotExprHeatmap(),
plotExprViolin(),
plotSumExprHeatmap()
Examples
plotSumExprLine(c("POU5F1","DNMT3B","TERF1","TDGF1","L1TD1","VIM","MAP1B","MARCKS","PTN","CDH2"),
                          sce)