Plot expression profiles along a pseudotime trajectory
Source:R/plotExpr.R
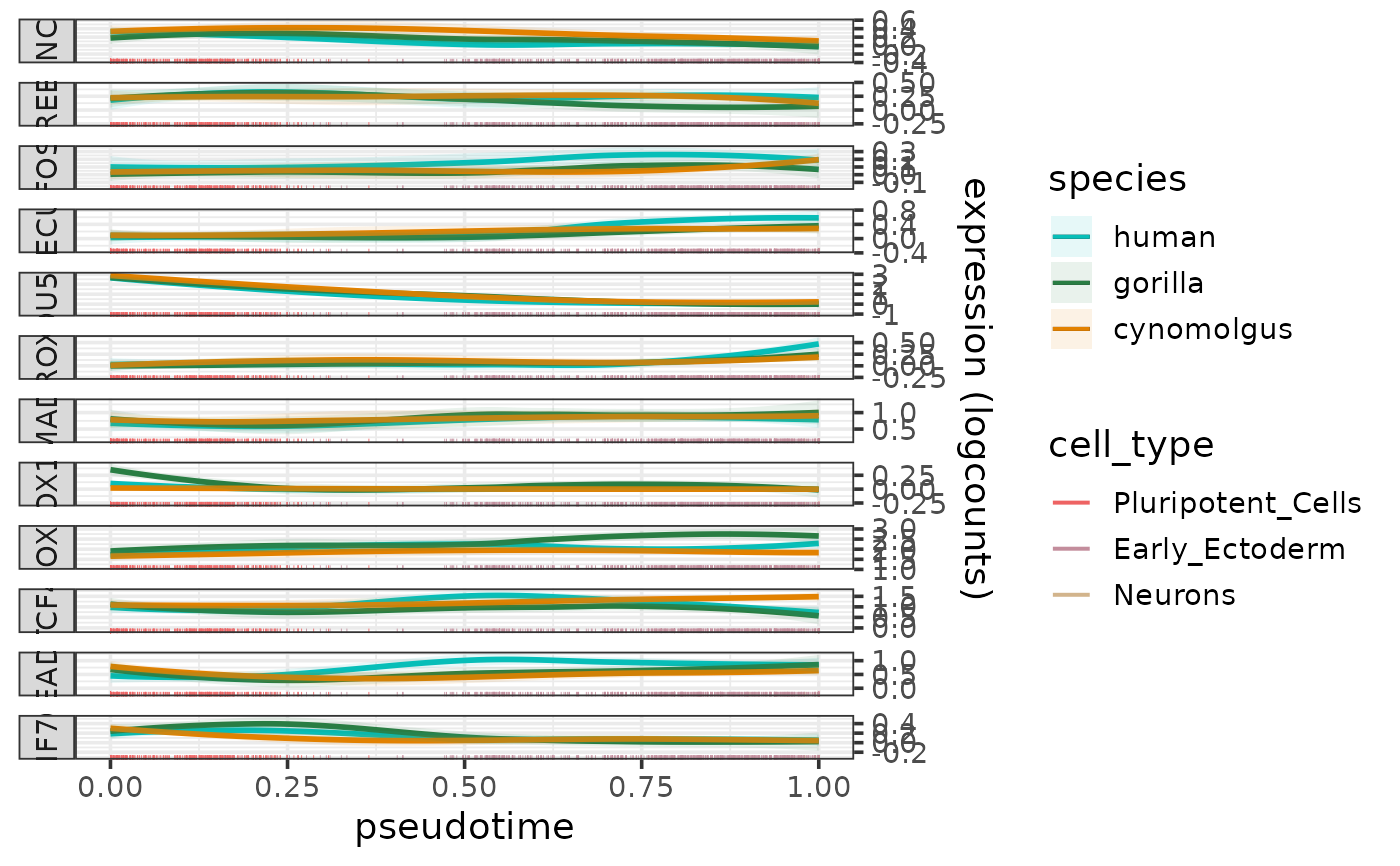
plotExprAlongPseudotime.RdPlots the expression profiles of one or more genes along a pseudotime trajectory per species.
Usage
plotExprAlongPseudotime(
  genes,
  sce,
  pseudotime_column = "pseudotime",
  cell_type_column = "cell_type",
  species_colors = NULL,
  cell_type_colors = NULL,
  font_size = 14,
  ncol = 1
)
Arguments
- genes
Character vector, the names of the genes for which the expression profiles should be plotted.
- sce
SingleCellExperimentobject containing the expression data (raw counts, logcounts and metadata) for all network genes. Required metadata columns:- species
Character, the name of the species.
- {{pseudotime_column}}
Numeric, inferred pseudotime.
- {{cell_type_column}}
Character, cell type annotation (optional).
- pseudotime_column
Character, the name of the pseudotime column in the metadata of
sce(default: "pseudotime").- cell_type_column
Character, the name of the cell type annotation column in the metadata of
sce(default: "cell_type", if there is no cell type annotation available or the user wants to omit the cell type rug plot, this parameter should be set to NULL).- species_colors
Character vector, colors per species.
- cell_type_colors
Character vector, colors per cell type.
- font_size
Numeric, font size (default: 14).
- ncol
Integer, the number of columns the genes (facets) should be organized into (default: 1).
Value
A curve plot as a ggplot object showing the expression profiles of the genes along the pseudotime trajectory per species.
Details
The function plots the expression profiles as smoothed curves colored by species and faceted by gene.
The species, pseudotime and cell type information are taken from the metadata slot of the input sce object, and the expression data are taken from the logcounts assay of the input sce object.
The smoothed expression profiles are fitted per species and gene using loess with the formula "expression ~ pseusotime". The 95% confidence intervals of the fitted lines are calculated using predict and shown as lightly colored areas around the lines.
If a cell type metadata column is specified by the parameter cell_type_column, the cell are shown as a rug plot along the pseudotime axis colored by cell types. The colors for the rug can be be controlled by the parameter cell_type_colors.
See also
Other functions to plot gene expression profiles:
plotExprHeatmap(),
plotExprViolin(),
plotSumExprHeatmap(),
plotSumExprLine()