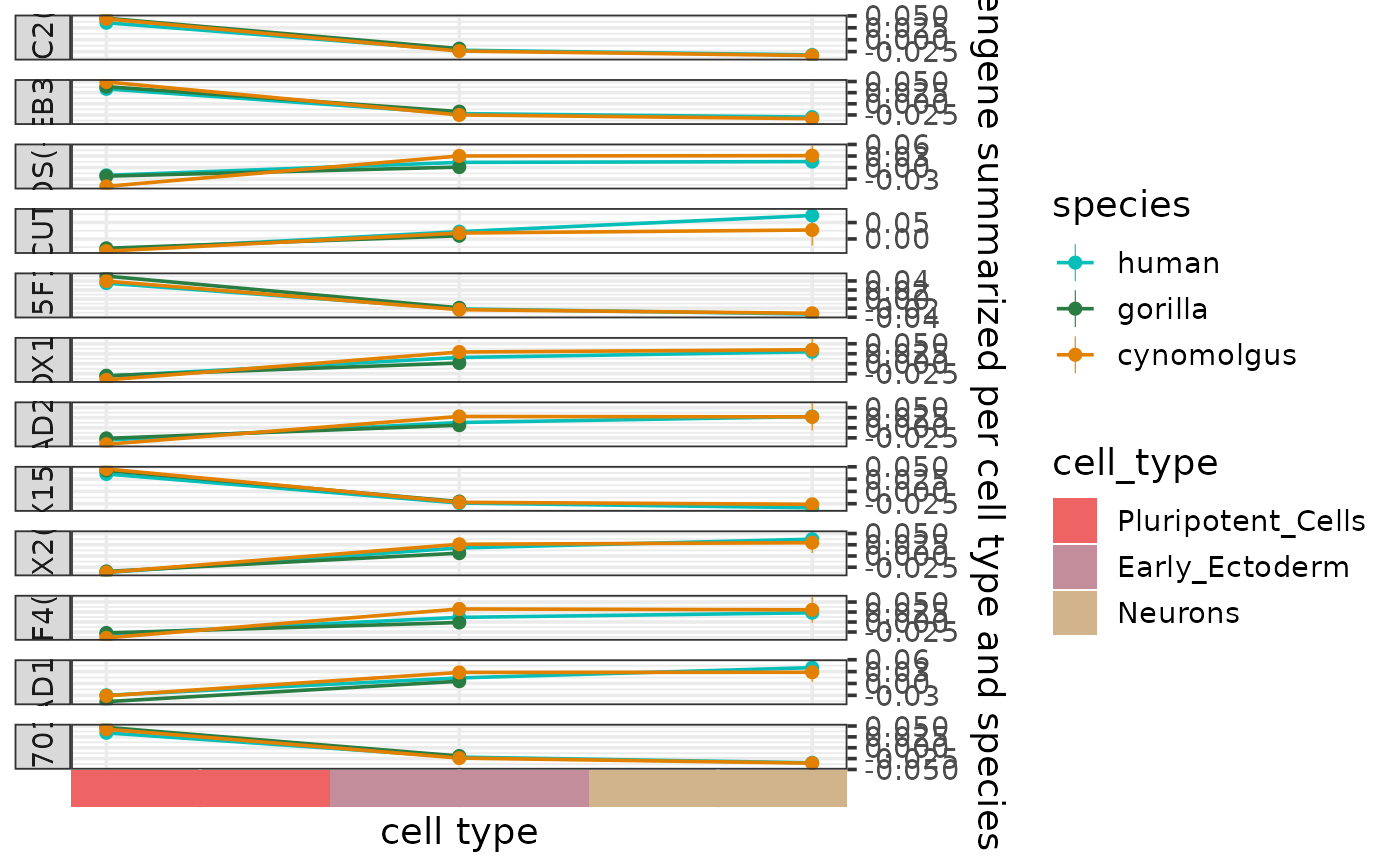
Plots the mean eigengene (or the mean of other types of summarized module expression profile) per cell type and species as a line plot
Usage
plotSumEigengenesLine(
  eigengenes,
  expr_column = "eigengene",
  cell_type_column = "cell_type",
  species_colors = NULL,
  cell_type_colors = NULL,
  font_size = 14
)
Arguments
- eigengenes
Data frame of eigengenes, required columns:
- cell
Character, the cell barcode.
- species
Character, the name of the species.
- {{cell_type_column}}
Character, cell type annotation.
- module
Character, transcriptional regulator and in case the eigengene was calculated for the positively or negatively regulated targets only, the direction of regulation (format: nameOfRegulator(+) or nameOfRegulator(-)).
- {{expr_column}}
Numeric, summarized module expression profiles (typically the eigengene, the mean expression of the module, or the expression of the regulator).
- expr_column
Character specifying the column of
eigengenesby which the heatmap should be colored. This column is expected to contain summarized module expression profiles, typically the eigengene (default: "eigengene"), the mean expression of the module, or the expression of the regulator.- cell_type_column
Character, the name of the cell type annotation column in
eigengenes(default: "cell_type").- species_colors
Character vector, colors per species.
- cell_type_colors
Character vector, colors per cell type.
- font_size
Numeric, font size (default: 14).
Value
A line plot as a ggplot object showing the summarized expression levels of the modules per cell type and species.
Details
A concept adapted from WGCNA, the eigengene summarizes the expression profile of an entire module, and it is calculated as the first principal component of the module expression data (see also calculateEigengenes). Other possible ways of representing the expression profile of a module include the mean expression and the regulator expression.
The function takes a data frame containing any of these summarized module expression profiles as input (normally the output of calculateEigengenes) and further summarizes them by taking the mean and its 95
The summarized module expression levels are then visualized as a scatter plot across the cell types, colored by species and faceted by module. To aid visual comparison across species, the data points of the same species are connected by lines across the cell types (this is not meant to represent continuity).
The cell types are depicted below the plot using cell_type_colors.
References
Zhang, B., & Horvath, S. (2005). A general framework for weighted gene co-expression network analysis. Statistical Applications in Genetics and Molecular Biology, 4, 17-60. https://doi.org/10.2202/1544-6115.1128
See also
Other functions to plot eigengene profiles:
plotEigengeneHeatmap(),
plotEigengenesAlongPseudotime(),
plotEigengenesViolin(),
plotSumEigengeneHeatmap()