Plot module eigengenes along a pseudotime trajectory
Source:R/plotExpr.R
plotEigengenesAlongPseudotime.RdPlots the eigengenes (or other types of summarized module expression profiles) along a pseudotime trajectory per species.
Usage
plotEigengenesAlongPseudotime(
  eigengenes,
  expr_column = "eigengene",
  pseudotime_column = "pseudotime",
  cell_type_column = "cell_type",
  species_colors = NULL,
  cell_type_colors = NULL,
  font_size = 14,
  ncol = 1
)
Arguments
- eigengenes
Data frame of eigengenes, required columns:
- cell
Character, the cell barcode.
- species
Character, the name of the species.
- {{pseudotime_column}}
Numeric, inferred pseudotime.
- {{cell_type_column}}
Character, cell type annotation (optional).
- module
Character, transcriptional regulator and in case the eigengene was calculated for the positively or negatively regulated targets only, the direction of regulation (format: nameOfRegulator(+) or nameOfRegulator(-)).
- {{expr_column}}
Numeric, summarized module expression profiles (typically the eigengene, the mean expression of the module, or the expression of the regulator).
- expr_column
Character specifying which column of
eigengenesthe heatmap should be colored by. This column is expected to contain summarized module expression profiles, typically the eigengene (default: "eigengene"), the mean expression of the module, or the expression of the regulator.- pseudotime_column
Character, the name of the pseudotime column in
eigengenes(default: "pseudotime").- cell_type_column
Character, the name of the cell type annotation column in
eigengenes(default: "cell_type", if there is no cell type annotation available or the user wants to omit the cell type rug plot, this parameter should be set to NULL).- species_colors
Character vector, colors per species.
- cell_type_colors
Character vector, colors per cell type.
- font_size
Numeric, font size (default: 14).
- ncol
Integer, the number of columns the modules (facets) should be organized into (default: 1).
Value
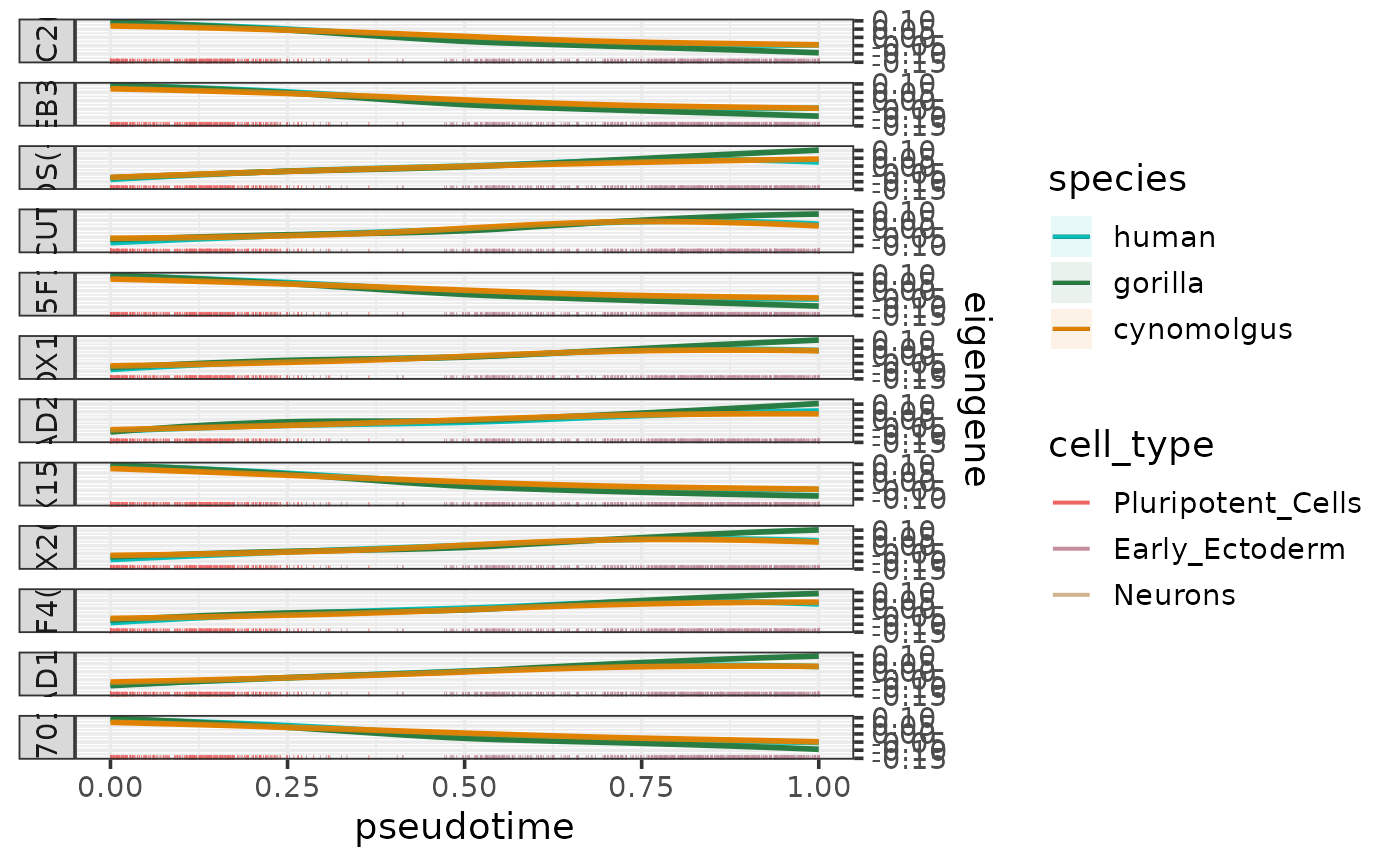
A curve plot as a ggplot object showing the summarized expression profiles of the modules along the pseudotime trajectory per species.
Details
A concept adapted from WGCNA, the eigengene summarizes the expression profile of an entire module, and it is calculated as the first principal component of the module expression data (see also calculateEigengenes). Other possible ways of representing the expression profile of a module include the mean expression and the regulator expression.
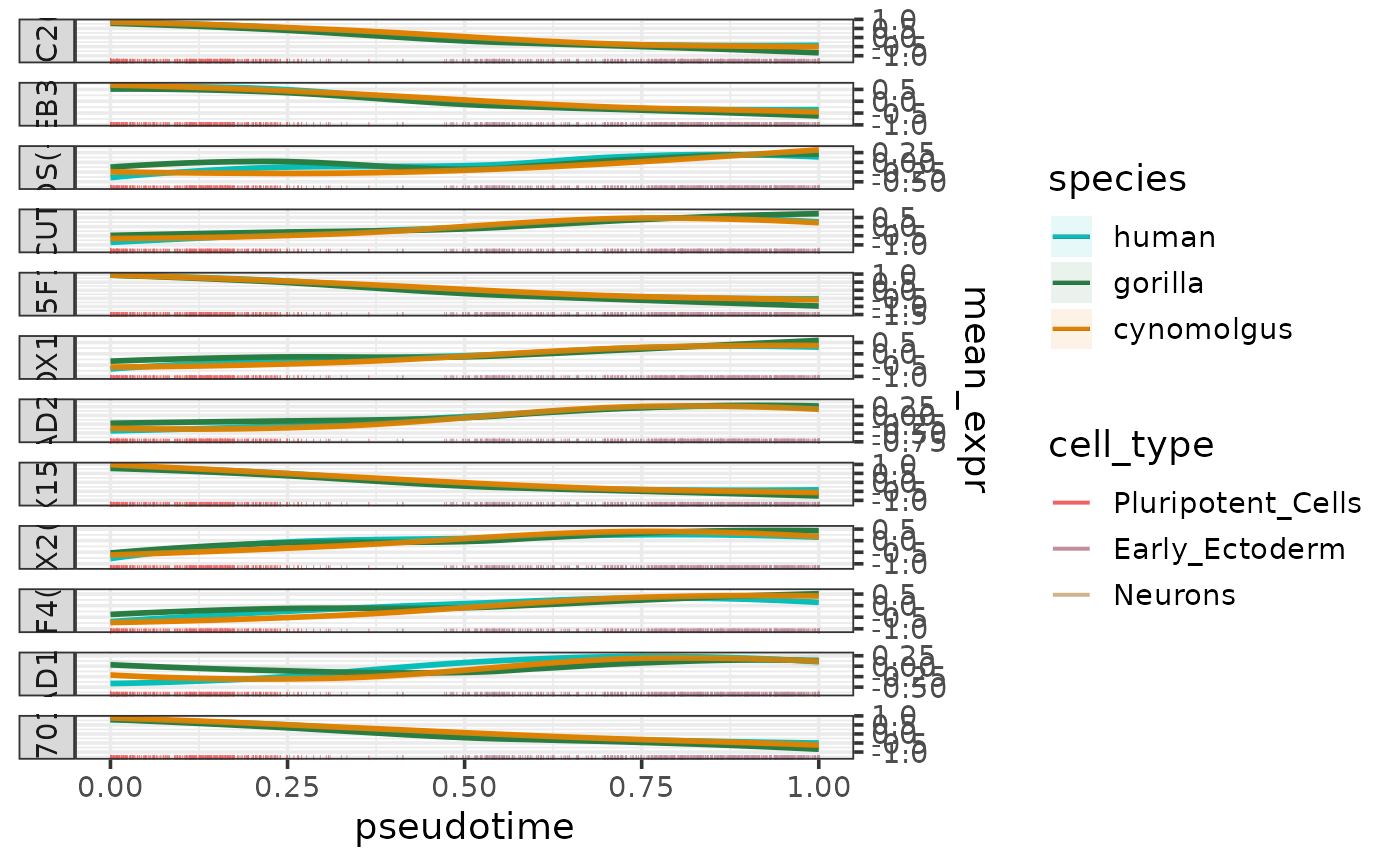
The function takes a data frame containing any of these summarized module expression profiles as input (normally the output of calculateEigengenes). The column containing the chosen type of summarized expression profile can be specified by the parameter expr_column (default: "eigengene").
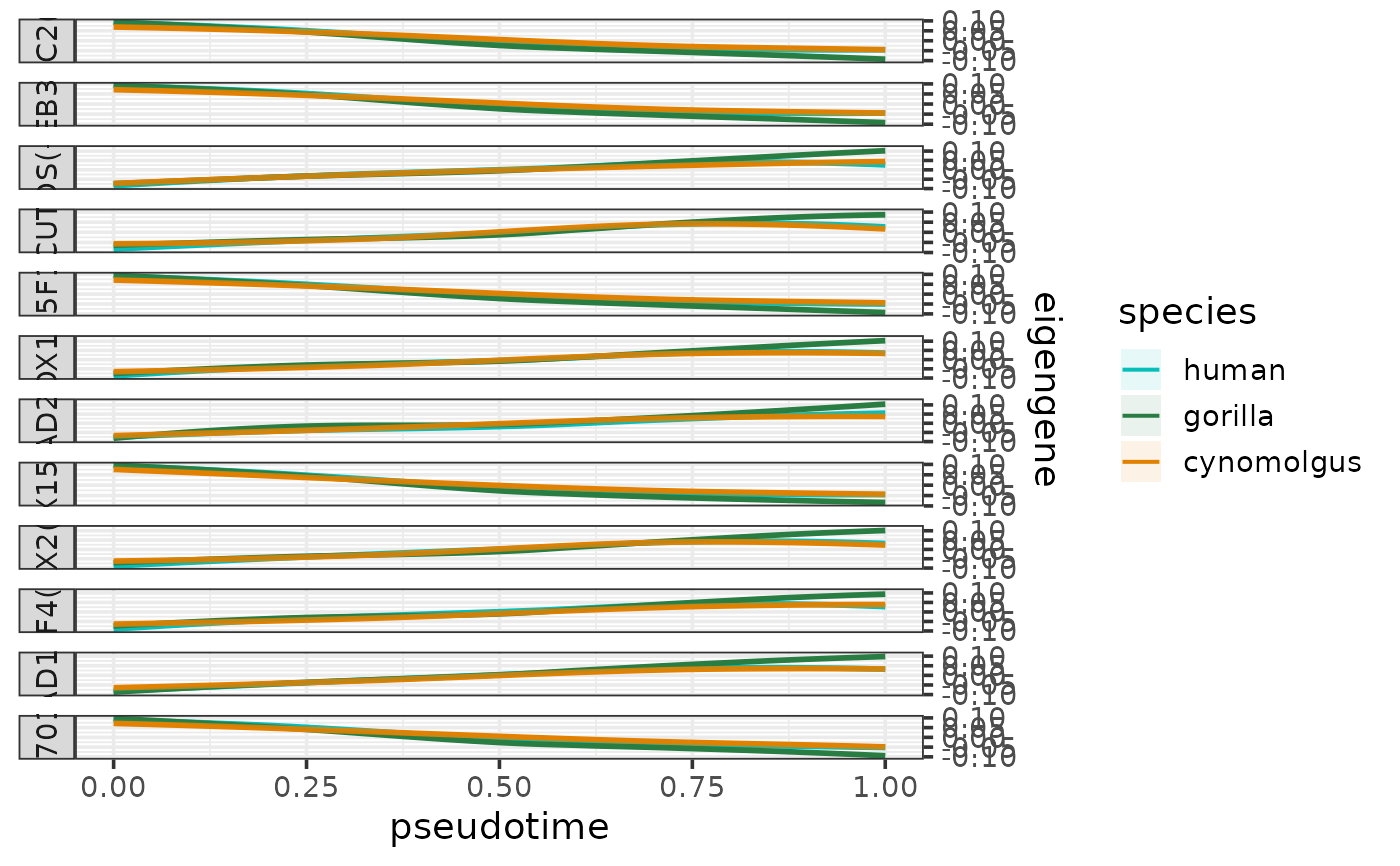
The values of this chosen metric are plotted as smoothed curves colored by species and faceted by module. The smoothed expression profiles are fitted per species and module using loess with the formula "expression ~ pseusotime". The 95% confidence intervals of the fitted lines are calculated using predict and shown as lightly colored areas around the lines.
If a cell type column is specified by the parameter cell_type_column, the cell are shown as a rug plot along the pseudotime axis colored by cell types. The colors for the rug can be be controlled by the parameter cell_type_colors.
If the eigengene (or mean expression) has been calculated for positively and negatively regulated targets separately, then these will appear as separate facets in the plot.
References
Zhang, B., & Horvath, S. (2005). A general framework for weighted gene co-expression network analysis. Statistical Applications in Genetics and Molecular Biology, 4, 17-60. https://doi.org/10.2202/1544-6115.1128
See also
Other functions to plot eigengene profiles:
plotEigengeneHeatmap(),
plotEigengenesViolin(),
plotSumEigengeneHeatmap(),
plotSumEigengenesLine()