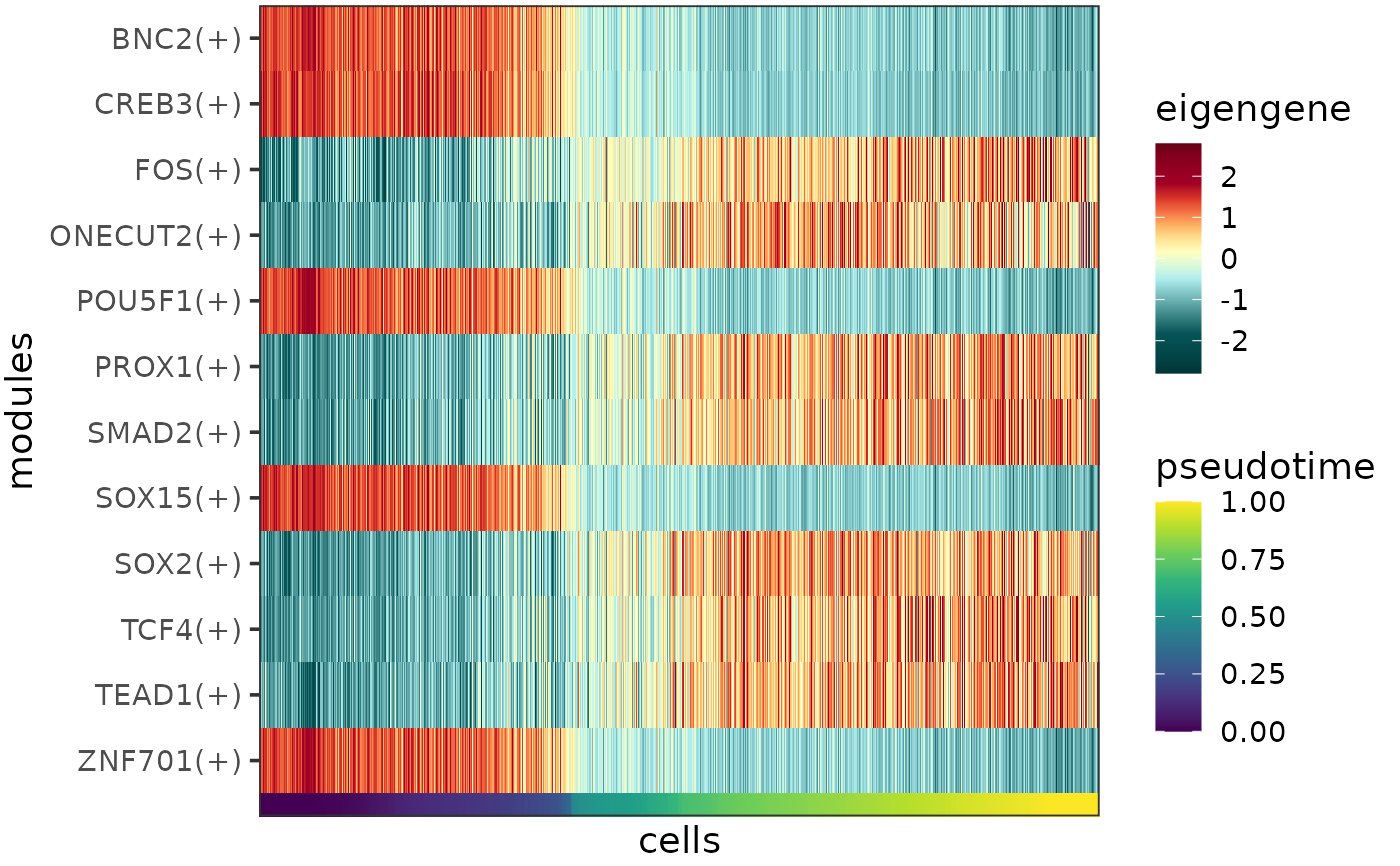
Plots the eigengenes (or other types of summarized module expression profiles) as a heatmap, with the cells ordered by pseudotime or cell type.
Usage
plotEigengeneHeatmap(
  eigengenes,
  expr_column = "eigengene",
  order_by = "pseudotime",
  heatmap_colors = NULL,
  annotation_colors = NULL,
  z_transform = TRUE,
  clip = ifelse(z_transform, 3, Inf),
  font_size = 14
)
Arguments
- eigengenes
Data frame of eigengenes, required columns:
- cell
Character, the cell barcode.
- {{order_by}}
Numeric or character, the column by which the cells should be ordered on the plot. Typically contains the inferred pseudotime, or the cell type labels.
- module
Character, transcriptional regulator and in case the eigengene was calculated for the positively or negatively regulated targets only, the direction of regulation (format: nameOfRegulator(+) or nameOfRegulator(-)).
- {{expr_column}}
Numeric, summarized module expression profiles (typically the eigengene, the mean expression of the module, or the expression of the regulator).
- expr_column
Character specifying the column of
eigengenesby which the heatmap should be colored. This column is expected to contain summarized module expression profiles, typically the eigengene (default: "eigengene"), the mean expression of the module, or the expression of the regulator.- order_by
Character specifying which column of
eigengenesby which the cells should be ordered on the plot. This column typically contains the inferred pseudotime (default: "pseudotime"), or the cell type labels.- heatmap_colors
Character vector, the heatmap colors for the variable specified by
expr_column. The vector can contain any number of colors that will be passed on to and converted into a continuous scale byscale_color_gradientn.- annotation_colors
Character vector, the colors for the variable specified by
order_by. If the variable is discrete, the vector should contain as many colors as there are unique values of the variable, if the variable is continuous, the vector can contain any number of colors that will be passed on to and converted into a continuous scale byscale_color_gradientn.- z_transform
Logical specifying whether z-transformation should be performed per module before plotting (default: TRUE).
- clip
Numeric specifying the degree of clipping. For each module, the expression level values that are more standard deviations away from the mean than
clipare treated as NA. Ifz_transformis set to TRUE, the default is 3 meaning that expression levels are clipped to the range of mean \(\pm\) 3\(\sigma\) per module, otherwise the default is Inf.- font_size
Numeric, font size (default: 14).
Details
A concept adapted from WGCNA, the eigengene summarizes the expression profile of an entire module, and it is calculated as the first principal component of the module expression data (see also calculateEigengenes). Other possible ways of representing the expression profile of a module include the mean expression and the regulator expression.
The function takes a data frame containing any of these summarized module expression profiles as input (normally the output of calculateEigengenes) and plots it as a heatmap, with columns corresponding to cells, rows corresponding to modules and colors corresponding to scaled and centered expression levels.
The column of the data frame containing the chosen type of summarized expression profile can be specified by the parameter expr_column (default: "eigengene"). The colors to represent the expression levels can be controlled by the parameter heatmap_colors.
The cells can be order by pseudotime, cell type or any other variable that makes sense in the given context, the name of the column containing the desired cell property can be specified by the parameter order_by (default: "pseudotime"). This cell property is visualized as a rug plot under the heatmap, the colors for the rug can be be controlled by the parameter annotation_colors.
If the eigengene (or mean expression) has been calculated for positively and negatively regulated targets separately, then these will appear as separate rows of the heatmap.
Expression levels are clipped to the range of mean \(\pm\) 3\(\sigma\) per gene, this can be changed via the parameter clip. Clipping aids visualization by preventing the outlier data points from squishing the rest of the data into a small color range. If clipping is not desired, please set clip to Inf.
References
Zhang, B., & Horvath, S. (2005). A general framework for weighted gene co-expression network analysis. Statistical Applications in Genetics and Molecular Biology, 4, 17-60. https://doi.org/10.2202/1544-6115.1128
See also
Other functions to plot eigengene profiles:
plotEigengenesAlongPseudotime(),
plotEigengenesViolin(),
plotSumEigengeneHeatmap(),
plotSumEigengenesLine()