Plot cross-species VS within-species preservation statistics per species pair
Source:R/plotPresStats.R
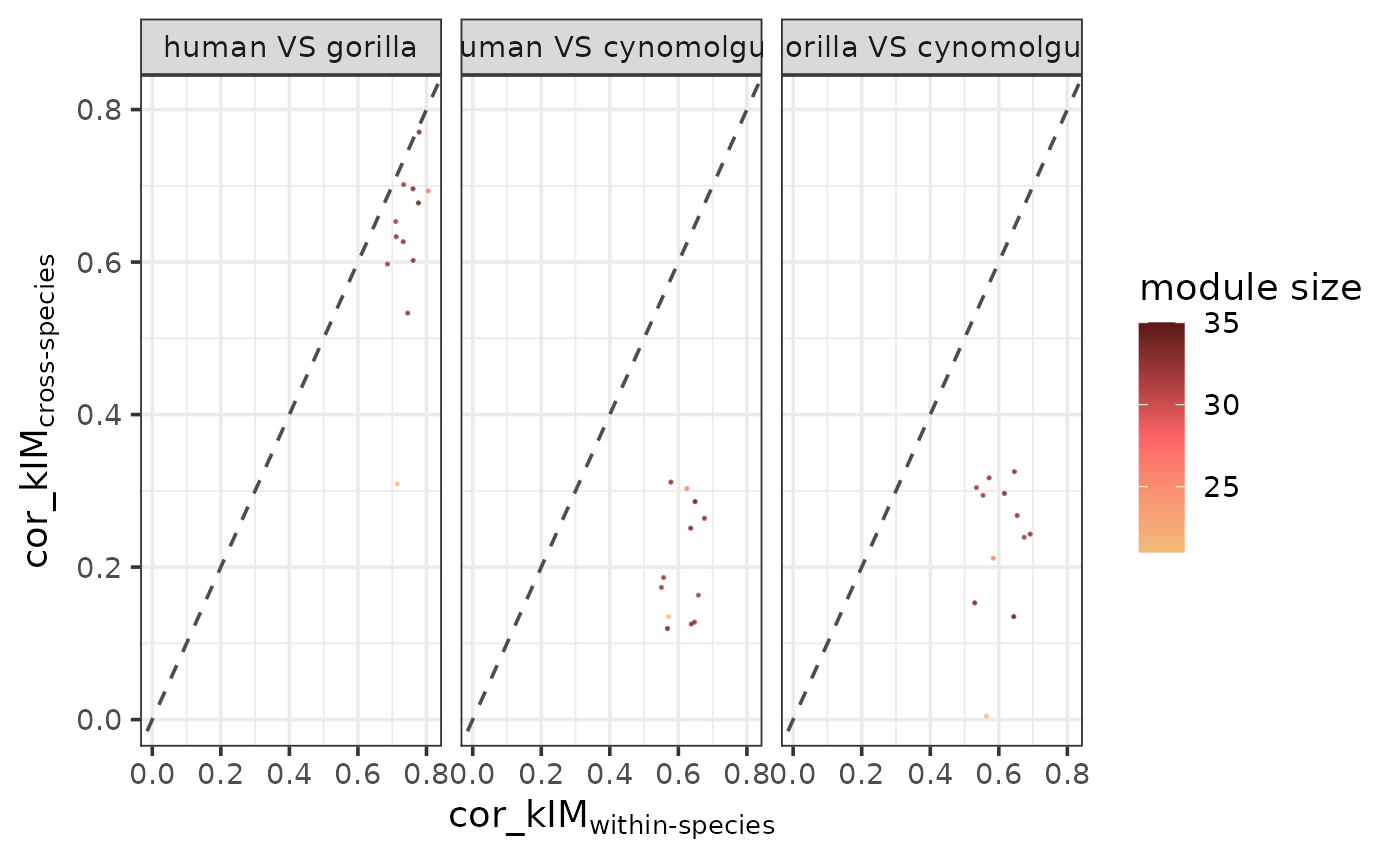
plotPresStats.RdPlots the cross-species VS within-species preservation scores for all possible species pairs. If a statistic is a good measure of module preservation, the within-species scores are expected to be higher than the cross-species scores for all species pairs, and the difference is expected to increase with increasing phylogenetic distance between the two species compared.
Usage
plotPresStats(
  pres_stats,
  random_pres_stats = NULL,
  stats,
  colors = NULL,
  font_size = 14,
  point_size = 0.1,
  point_alpha = 0.7
)
Arguments
- pres_stats
Data frame of the preservation statistics for the actual (pruned) modules. Required columns:
- regulator
Character, transcriptional regulator.
- module_size
Integer, the numer of target genes assigned to a regulator (only needed if the data points are desired to be colored by module size).
- replicate1, replicate2
Character, the names of the replicates compared.
- species1, species2
Character, the names of the species
replicate1andreplicate2belongs to, respectively.- {{nameOfStat}}
Numeric, one or more columns containing the preservation statistic of interest per module and replicate pair.
- random_pres_stats
Data frame of the preservation statistics for the random modules (optional). If provided, the following columns are required:
- regulator
Character, transcriptional regulator.
- replicate1, replicate2
The names of the replicates compared.
- species1, species2
The names of the species
replicate1andreplicate2belongs to, respectively.- {{nameOfStat}}
Numeric, one or more columns containing the preservation statistic(s) of interest per module and replicate pair.
- stats
Character or character vector, the name(s) of the column(s) containing the statistics of interest.
- colors
Character vector, either the colors to visualize the module sizes (if only
pres_statsis provided), or the colors to visualize the actual and random modules (if bothpres_statsandrandom_pres_statsare provided). In the first case, the vector can contain any number of colors that will be passed on to and converted into a continuous scale byscale_color_gradientn. In the second case, the vector should contain 2 colors for the actual and random modules.- font_size
Numeric, font size (default: 14).
- point_size
Numeric, the size of the points (default: 0.3).
- point_alpha
Numeric, the opacity of the points (default: 0.7).
Value
A scatterplot as a ggplot object showing the cross-species VS within-species preservation scores per species pair for all pruned modules and if provided, all random modules.
Details
As part of the CroCoNet approach, pairwise module preservation scores are calculated between replicates, both within and across species (see calculatePresStats) to gain information about the cross-species differences but also about the within-species diversity of the modules. These correlation-based preservation statistics quantify how well the module topology is preserved between the networks of two replicates.
For each possible speciesA-speciesB pair in the data, the function first subsets the within-species scores for speciesA, the within-species scores for speciesB and the cross-species scores between speciesA and speciesB, then calculates the mean of the within-species scores as well as the mean of the cross-species scores per module.
For example, if there are 2 species, human and gorilla, with 3 human replicates (h1, h2 and h3), and 2 gorilla replicates (g1 and g2), for a single module there will be 3 preservation scores within the human replicates (\(p_{h1-h2}\), \(p_{h1-h3}\) and \(p_{h2-h3}\)), 1 preservation score within the gorilla replicates (\(p_{g1-g2}\)) and 6 preservation scores across the 2 species (\(p_{h1-g1}\), \(p_{h1-g2}\), \(p_{h2-g1}\), \(p_{h2-g2}\), \(p_{h3-g1}\) and \(p_{h3-g2}\)). For this module and the human-gorilla species pair, the summarized within-species score will then be the mean of the 4 within-species scores (\(mean(p_{h1-h2}, p_{h1-h3}, p_{h2-h3}, p_{g1-g2})\)) and the cross-species score will be the mean of the 6 cross-species scores (\(mean(p_{h1-g1}, p_{h1-g2}, p_{h2-g1}, p_{h2-g2}, p_{h3-g1}, p_{h3-g2})\)).
After calculating the summarized scores for all modules and species pairs, the cross-species scores are plotted against the within-species scores faceted by species pair. The within-species scores are expected to be higher than the cross-species scores, thus the data points are expected to fall under the diagonal in all facets. However, the more phylogenetically distant two species are, the bigger deviation we expect from the diagonal.
If random_pres_stats is provided, the actual and the random modules are plotted together, shown in 2 different colors. The actual modules are expected to better preserved than the random modules (especially within species), therefore the 2 sets of modules are expected to cluster separately on the plot, with the actual modules located towards the higher (within-species) scores.
If random_pres_stats is not provided, only the actual modules in pres_stats are shown on the plot. In this case, if the column "module_size" is present in pres_stats, the data points are colored by module size.
If several different statistics are input, these will be shown as the rows of the faceted plot. When it comes to choosing the best statistic, it is recommended to take the one that follows the most the expected trends in terms of within-species VS cross-species scores, phylogeny, and actual VS random modules.
See also
Other functions to plot preservation statistics:
comparePresStats(),
plotPresStatDistributions()