Plot the distributions of preservation statistics
Source:R/plotPresStats.R
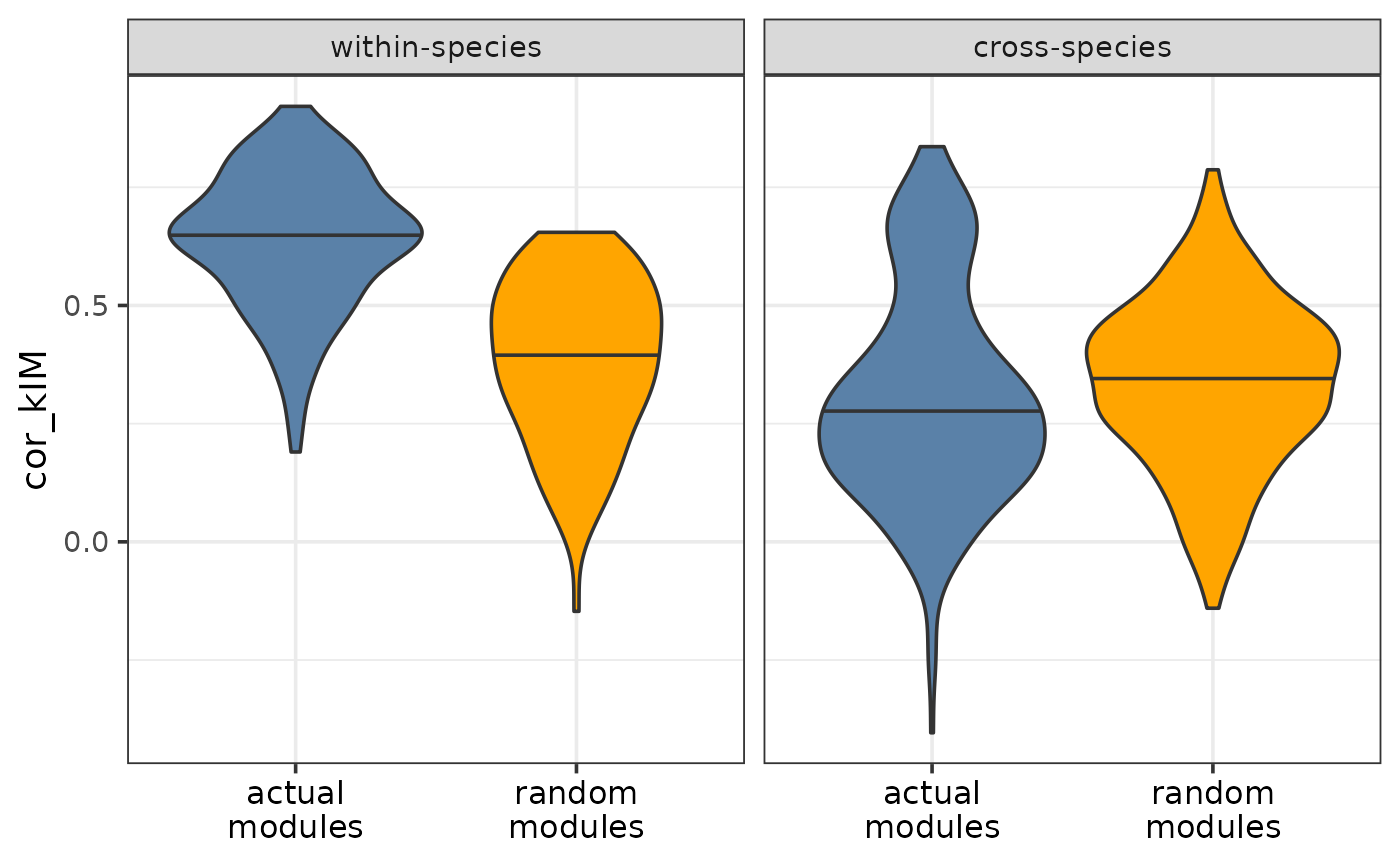
plotPresStatDistributions.RdPlots the distribution(s) of the chosen preservation statistic(s) for the actual and random modules and for within-species and cross-species replicate pairs. If a statistic is a good measure of module preservation, the preservation scores are expected to be 1) higher for the actual modules than for the random modules and 2) higher within species than across species.
Usage
plotPresStatDistributions(
  pres_stats,
  random_pres_stats,
  stats,
  colors = NULL,
  font_size = 14
)
Arguments
- pres_stats
Data frame of the preservation statistics for the actual (pruned) modules. Required columns:
- regulator
Character, transcriptional regulator.
- replicate1, replicate2
Character, the names of the replicates compared.
- species1, species2
Character, the names of the species
replicate1andreplicate2belongs to, respectively.- {{nameOfStat}}
Numeric, one or more columns containing the preservation statistic(s) of interest per module and replicate pair.
- random_pres_stats
Data frame of the preservation statistics for the random modules. Required columns:
- regulator
Character, transcriptional regulator.
- replicate1, replicate2
The names of the replicates compared.
- species1, species2
The names of the species
replicate1andreplicate2belongs to, respectively.- {{nameOfStat}}
Numeric, one or more columns containing the preservation statistic(s) of interest per module and replicate pair.
- stats
Character or character vector, the name(s) of the column(s) containing the statistic(s) of interest.
- colors
Character vector of length 2, the colors for the actual and random modules.
- font_size
Numeric, font size (default: 14).
Value
A violin plot as a ggplot object showing the distributions of chosen preservation statistics both within species and across species and both for the actual and for the random modules.
Details
As part of the CroCoNet approach, pairwise module preservation scores are calculated between replicates, both within and across species (see calculatePresStats) to gain information about the cross-species differences but also about the within-species diversity of the modules. These correlation-based preservation statistics quantify how well the module topology is preserved between the networks of two replicates. The statistics are calculated not just for the actual, biologically meaningful modules, but also for random modules with matching sizes.
The actual modules are expected to be more preserved than the random modules, and all modules, but especially the actual ones, are expected to be more preserved within species than across species. The function plots the distributions of the within-species and cross-species scores both for the actual and for the random modules and thus allows these expectations to be visually checked. If several different statistics are input, these will be shown as the rows of the faceted plot. When it comes to choosing the best statistic, it is recommended to take the one that follows these expected trends the most.
See also
Other functions to plot preservation statistics:
comparePresStats(),
plotPresStats()