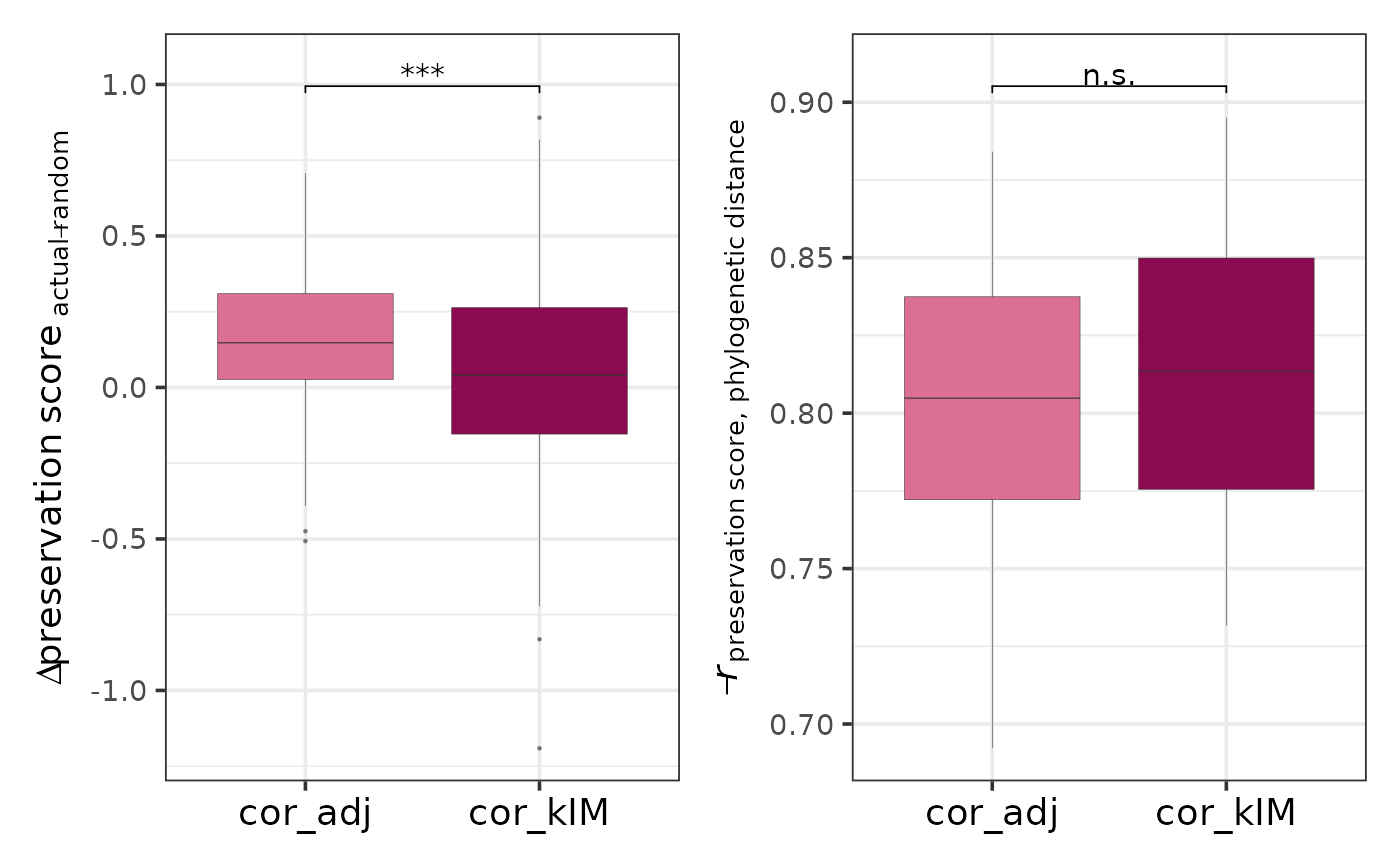
Compares the two topology-based preservation statistics - correlation of adjacencies (cor_adj) and correlation of intramodular connectivities (cor_kIM) - in terms of their ability to distinguish actual modules from random ones and to capture the expected decrease in module preservation with increasing phylogenetic distance.
Arguments
- pres_stats
Data frame of the preservation statistics for the actual (pruned) modules. Required columns:
- regulator
Character, transcriptional regulator.
- replicate1, replicate2
Character, the names of the replicates compared.
- species1, species2
Character, the names of the species
replicate1andreplicate2belongs to, respectively.- cor_adj
Numeric, correlation of adjacencies per module and replicate pair.
- cor_kIM
Numeric, correlation of intramodular connectivities per module and replicate pair.
- random_pres_stats
Data frame of the preservation statistics for the random modules. Required columns:
- regulator
Character, transcriptional regulator.
- replicate1, replicate2
The names of the replicates compared.
- species1, species2
The names of the species
replicate1andreplicate2belongs to, respectively.- cor_adj
Numeric, correlation of adjacencies per random module and replicate pair.
- cor_kIM
Numeric, correlation of intramodular connectivities per random module and replicate pair.
- tree
Optional object of class
phylo, the phylogenetic tree of the species (default: NULL).- colors
Character vector of length 2, the colors for
cor_adjandcor_kIM.- font_size
Numeric, font size (default: 14).
Value
A boxplot as a ggplot object comparing how well each preservation statistic can distinguish actual and random modules and capture phylogenetic information.
Details
As part of the CroCoNet approach, pairwise module preservation scores are calculated between replicates, both within and across species (see calculatePresStats) to gain information about the cross-species differences but also about the within-species diversity of the modules. These correlation-based preservation statistics quantify how well the module topology is preserved between the networks of two replicates. While cor_adj compares fine-grained topology at the level of adjacencies per edge, cor_kIM compares higher-level topology based on intramodular connectivities, gene-level summaries of the individual adjacencies. The statistics are calculated not just for the actual, biologically meaningful modules, but also for random modules with matching sizes.
The function plots two distributions for both cor_adj and cor_kIM:
1) the difference in preservation between each actual and corresponding random module, and
2) the inverse correlation between preservation and phylogenetic distance for each actual module (if tree is provided) or the difference in preservation between the within-species and cross-species groups for each actual module (if tree is not provided).
The higher these values are, the better the preservation statistic performs, since the actual modules are expected to be more preserved than the random modules, and all modules, but especially the actual ones, are expected to be more preserved between closely related species than between phylogenetically distant species.
Since modules that are too similar to random are excluded in a later step of the worklow (see filterModuleTrees), the actual–random comparison mainly serves as a diagnostic check to verify whether the preservation statistics are informative for the dataset at all. The phylogenetic signal is more directly related to the downstream module conservation analysis and should therefore be the primary criterion when choosing the most suitable preservation statistic.
See also
Other functions to plot preservation statistics:
plotPresStatDistributions(),
plotPresStats()