Plots the tree representations of one or more modules.
Usage
plotTrees(
  trees,
  show_labels = TRUE,
  species_colors = NULL,
  font_size = 14,
  tip_size = 1,
  branch_width = 0.4,
  ncol = NULL
)
Arguments
- trees
phyloobject or a named list ofphyloobjects, the tree representations(s) of one or more modules.- show_labels
Logical, if TRUE (default), the each tip will be labelled as the corresponding replicate, if FALSE, tips are not labelled.
- species_colors
Character vector, tip colors per species.
- font_size
Numeric, font size (default: 14).
- tip_size
Numeric, the size of the labels/circles at the tips (default: 1).
- branch_width
Numeric, the widths of the tree branches (default: 0.4).
- ncol
Integer, the number of columns the subplots should be organized into if several modules are input. If NULL (default), the dimensions of the grid will follow the default of
wrap_plots.
Value
A ggtree object in case trees is a single phylo object and a patchwork object in case trees is a list of phylo objects.
Details
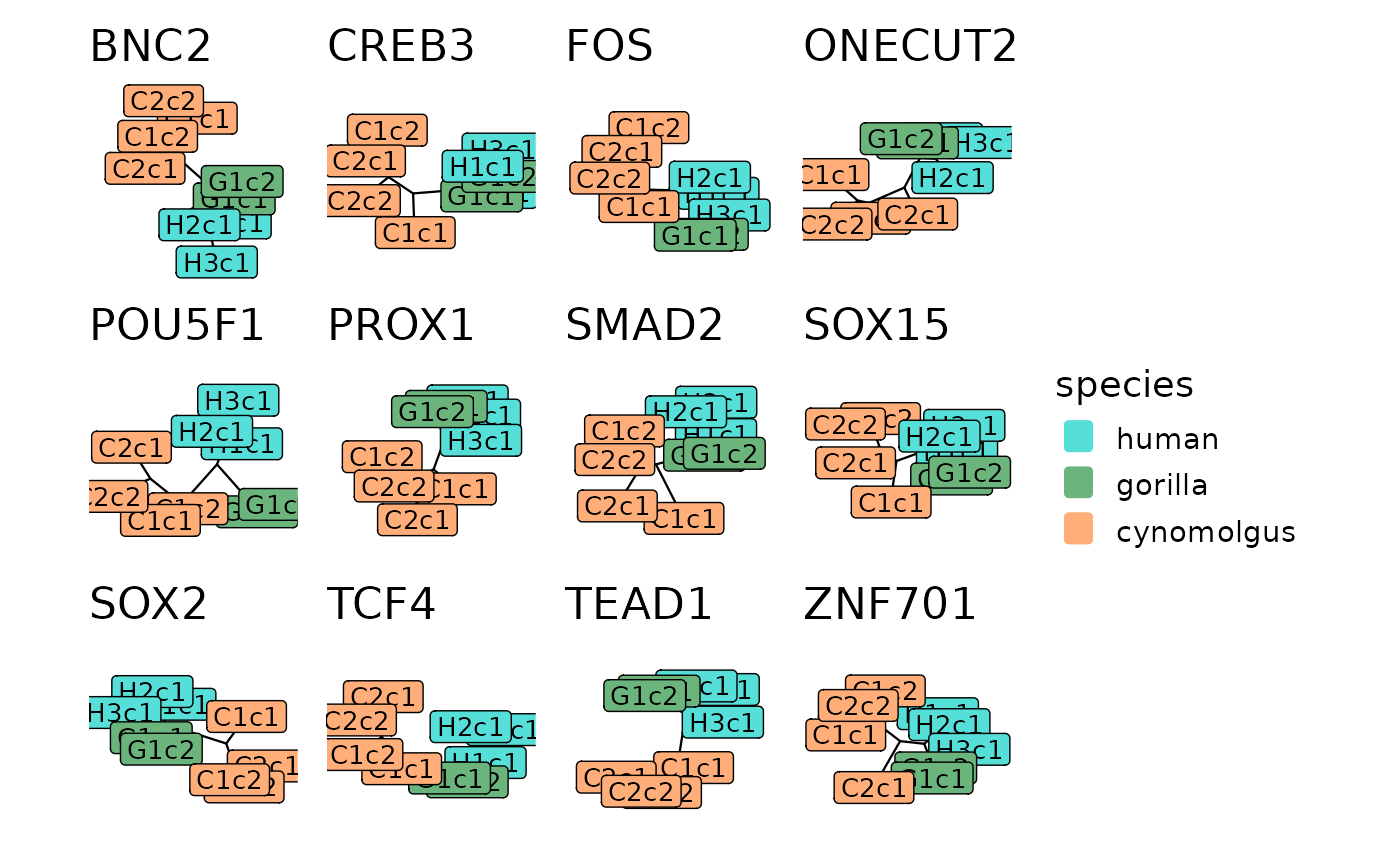
The module trees are reconstructed based on pairwise preservation scores between replicates, both within and across species (see reconstructTrees). The tips of the resulting tree represent the replicates and the branch lengths represent the dissimilarity of module connectivity patterns between the networks of 2 replicates. Therefore, if 2 tips fall close to each other within a module tree, it means that the module topology is similar between the corresponding replicates.
These trees carry information about the cross-species conservation of a module. If a module is diverged between 2 species (i.e. it is poorly preserved between the species but well-preserved within each species), we expect the tips of the tree to separate according to species and the 2 species to be connected by a long branch. In contrast, if a module is conserved between 2 species (i.e. it is similarly preserved both within and across species), we expect the tips of the different species to be well-mixed within the tree with no systematic separation.
The module trees are plotted using ggtree as unrooted trees with 'daylight' layout and the tips are colored based on their species identity. If show_labels is set to TRUE, the tips will be in addition labelled as the corresponding replicate.
If the aim is to plot trees of several modules together, the input should be a named list of module trees. The ggtree plots are in this case combined together into a single patchwork object with the titles of the subplots matching the names of the input list. All subplots have the same scale so that the branch lengths are comparable across modules.
Examples
plotTrees(trees)
#> Warning: Ignoring unknown parameters: `label.size`
#> Warning: Ignoring unknown parameters: `label.size`
#> Warning: Ignoring unknown parameters: `label.size`
#> Warning: Ignoring unknown parameters: `label.size`
#> Warning: Ignoring unknown parameters: `label.size`
#> Warning: Ignoring unknown parameters: `label.size`
#> Warning: Ignoring unknown parameters: `label.size`
#> Warning: Ignoring unknown parameters: `label.size`
#> Warning: Ignoring unknown parameters: `label.size`
#> Warning: Ignoring unknown parameters: `label.size`
#> Warning: Ignoring unknown parameters: `label.size`
#> Warning: Ignoring unknown parameters: `label.size`
#> Warning: Ignoring unknown parameters: `label.size`
#> Warning: Ignoring unknown parameters: `label.size`
#> Warning: Ignoring unknown parameters: `label.size`
#> Warning: Ignoring unknown parameters: `label.size`
#> Warning: Ignoring unknown parameters: `label.size`
#> Warning: Ignoring unknown parameters: `label.size`
#> Warning: Ignoring unknown parameters: `label.size`
#> Warning: Ignoring unknown parameters: `label.size`
#> Warning: Ignoring unknown parameters: `label.size`
#> Warning: Ignoring unknown parameters: `label.size`
#> Warning: Ignoring unknown parameters: `label.size`
#> Warning: Ignoring unknown parameters: `label.size`