In the CroCoNet approach, networks are reconstructed per replicate and combined into a single phylogeny-aware consensus network which is the basis of the module assignment.
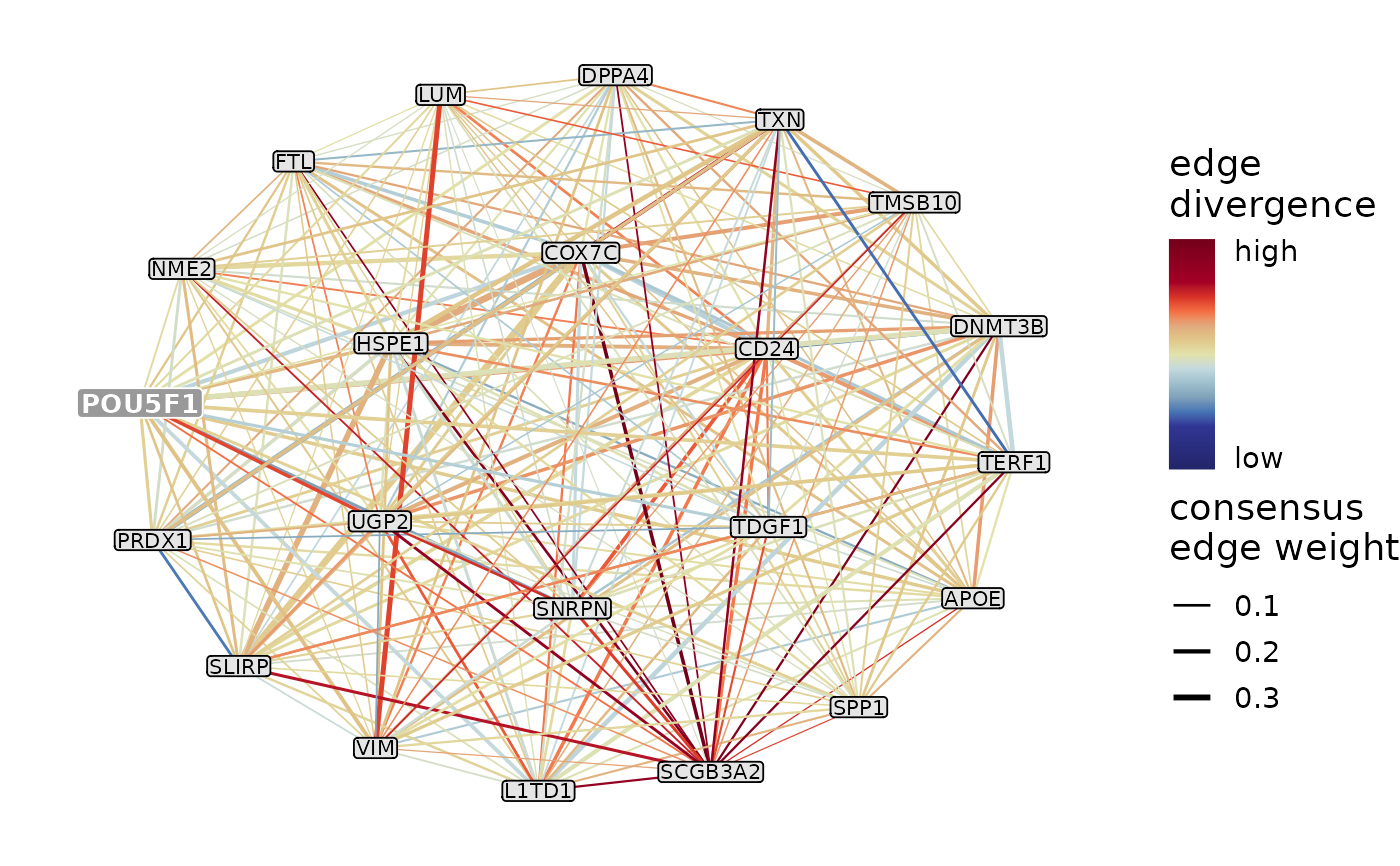
This function selects the intramodular edges of the input module(s) in the consensus network, orders them by the consensus edge weight and keeps the top N edges per module for plotting. This means that only those module member genes will appear on the plot that are involved in the top N connections, the regulator itself might also be omitted if it is not particularly well-connected.
The edges that were kept are plotted using ggraph per module. The default layout is "kk", other reasonable options include "stress", "circle", "nicely", "dh", "graphopt", "mds", "fr", "gem" and "drl" (see also ggraph, layout_tbl_graph_stress and layout_tbl_graph_igraph). The width of the edges represents the consensus edge weights, the range of widths can be set using edge_width.
If color_by is set to "edge_divergence" (the default), for each edge an edge divergence score is calculated based on its edge weights in the networks of individual replicates. The edge weights are compared across species using an ANOVA, and the F-statistic (i.e. between-species variability / within-species variability) is regarded as the measure of edge divergence and used to color the edges on the plot. To calculate this information, network_list and replicate2species has to be provided.
If color_by is set to "direction", the edges are colored based on the direction of interaction (positively correlated/coexpressed or negatively correlated/anti-coexpressed) between the 2 genes that from the edge. This information is taken from the direction edge attribute of consensus_network.
If the aim is to plot the networks of several modules together, the input module_names should be a vector of module names. The ggraph plots are in this case combined together into a single patchwork object with the titles of the subplots matching the elements of module_names. All subplots have the same scale so that the edge weights and divergence scores (if color_by = "edge_divergence") are comparable across modules.
Usage
plotNetworks(
  module_names,
  pruned_modules,
  consensus_network,
  network_list = NULL,
  replicate2species = NULL,
  N = 300L,
  color_by = "edge_divergence",
  n_cores = 1L,
  layout = "kk",
  seed = 0,
  colors = NULL,
  font_size = 14,
  edge_width = c(0.2, 1.2),
  ncol = NULL
)
Arguments
- module_names
Character or character vector, the name(s) of the module(s) of interest.
- pruned_modules
Data frame of the pruned modules, required columns:
- regulator
Character, transcriptional regulator.
- target
Character, target gene of the transcriptional regulator (member of the regulator's pruned module).
- consensus_network
igraphobject, the consensus network across all species and replicates.- network_list
A named list of
igraphobjects containing the networks of all replicates (only needed ifcolor_byis set to "edge_divergence").- replicate2species
A data frame that specifies which species each replicate belongs to (only needed if
color_byis set to "edge_divergence"), required columns:- replicate
Character, name of the replicate.
- species
Character, name of the species.
- N
Integer, the number of edges to plot (default: 300).
- color_by
Character, one of "edge_divergence" and "direction", specifies whether the edges should be colored by the degree of edge divergence across species (default) or the direction of interaction between the 2 genes that form the edge, i.e. positively or negatively correlated.
- n_cores
Integer, the number of cores (default: 1).
- layout
Character, graph layout (default: "kk", other reasonable options are "auto", "stress", "star", "circle", "nicely", "dh", "gem", "graphopt", "grid", "mds", "fr", "drl", "eigen", "fabric", "linear" and "unrooted"). See also
ggraph,layout_tbl_graph_stressandlayout_tbl_graph_igraph.- seed
Integer, the seed for setting up the graph layout (default: 0, only relevant for certain layouts such as "gem", "nicely", "dh", "graphopt", "fr" and "drl").
- colors
Character vector, the colors to visualize the edge directions or edge divergences. If
color_byis set to "edge_divergence", the vector can contain any number of colors that will be passed on to and converted into a continuous scale byscale_color_gradientn. Ifcolor_byis set to "direction", the vector should contain 2 colors for the positively and negatively correlated gene pairs.- font_size
Numeric, font size (default: 14).
- edge_width
Numeric vector of length 2, the range of edge widths for plotting the graph edges (default: c(0.2, 1.2)).
- ncol
Integer, the number of columns the subplots should be organized into if several modules are input. If NULL (default), the dimensions of the grid will follow the default of
wrap_plots.
Value
A ggraph object in case module_names is a single module name and a patchwork object in case module_names is a vector of module names.
Details
Plots the top N strongest connections of the chosen module(s) based on the consensus network. The edge width indicates the consensus edge weights, while the edge color indicates either the degree of edge divergence across species or the direction of interaction between the 2 genes that form the edge (positively/negatively correlated).