Plot the distribution of module sizes
Source:R/plotModuleSizeDistribution.R
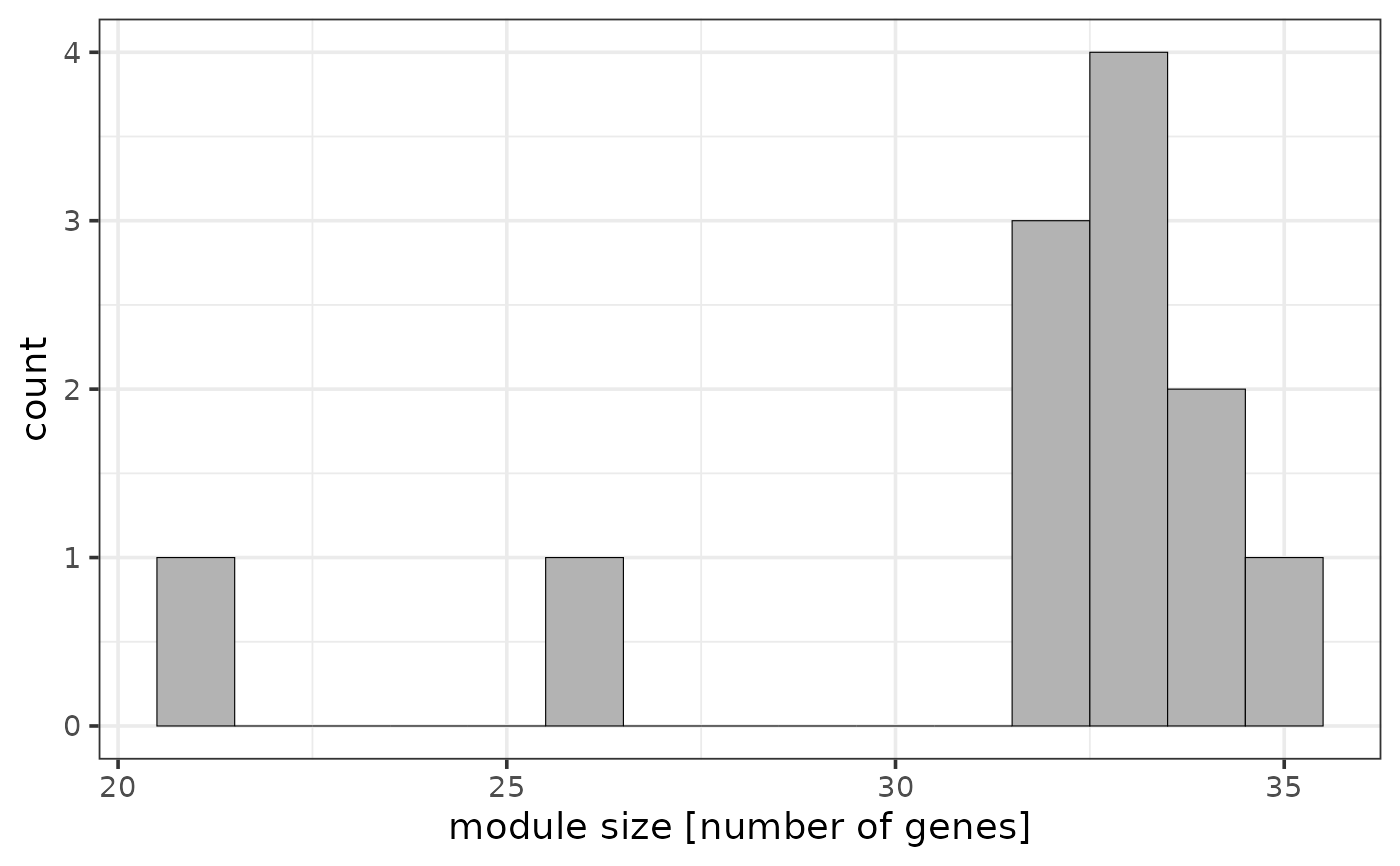
plotModuleSizeDistribution.RdPlots the distribution of module sizes (i.e. the number of target genes assigned to each regulator) as a histogram.
R/plotModuleSizeDistribution.R
plotModuleSizeDistribution.RdPlots the distribution of module sizes (i.e. the number of target genes assigned to each regulator) as a histogram.