Plot the distance matrices of replicates based on module connectivity patterns
Source:R/plotDistMats.R
plotDistMats.RdPlots the pairwise distances between replicates based on module connectivity patterns for one or more modules.
Arguments
- dist_dfs
Data frame or a named list of data frames containing the distance measures per replicate pair for one or more modules. Required columns for each data frame:
- replicate1, replicate2
Character the names of the replicates compared.
- species1, species2
Character, the names of the species
replicate1andreplicate2belong to, respectively.- dist
Numeric, distance measure ranging from 0 to 1, calculated based on the preservation score of the given module between
replicate1andreplicate2.
- colors
Character vector, the colors to visualize the distances. The vector can contain any number of colors that will be passed on to and converted into a continuous scale by
scale_color_gradientn.- font_size
Numeric, font size (default: 14).
- ncol
Integer, the number of columns the subplots should be organized into if several modules are input. If NULL (default), the dimensions of the grid will follow the default of
wrap_plots.
Value
A ggplot object in case dist_dfs is a single data frame and a patchwork object in case dist_dfs is a list of data frames.
Details
As part of the CroCoNet approach, pairwise module preservation scores are calculated between replicates, both within and across species (see calculatePresStats) to gain information about the cross-species differences but also about the within-species diversity of the modules. These correlation-based preservation statistics quantify how well the module connectivity patterns are preserved between the networks of two replicates. They can be converted into distance measures using the formula dist = (1 - pres)/2 (see convertPresToDist).
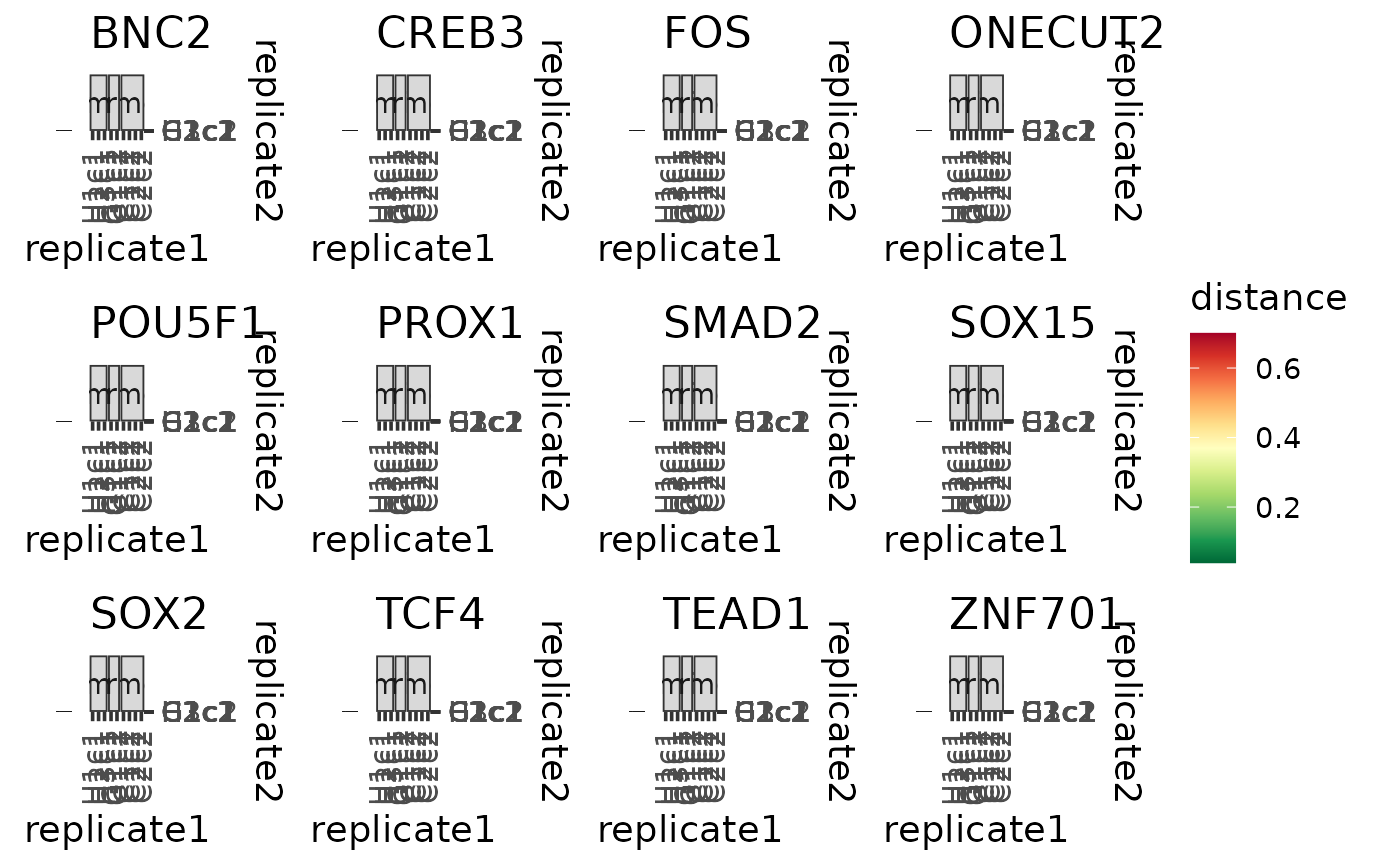
This function plots the distance measures as a tile plot where each tile corresponds to a pair of replicates and the color of the tile corresponds to the distance based on module connectivity patterns between this pair of replicates. The distance of a replicate with itself is always 0 and thus not meaningful, therefore these tiles are colored grey.
If the aim is to plot distance matrices for several modules together, the input should be a named list of data frames, each containing the distances for one of the modules. The tile plots are in this case combined together into a single patchwork object with the titles of the subplots matching the names of the input list. All subplots have the same scale so that the distances are comparable across modules.